Hasty Impressions: dotCover 1.1
I tried JetBrains dotCover 1.1, integrated with ReSharper 5.1 running in VS2008.
The Cost
A lifetime license, with 1 year of free upgrades isThis isn't usurious, but considering that ReSharper C# edition, a tool that changes the way I work every single day, is $249, it's enough.
VS integration
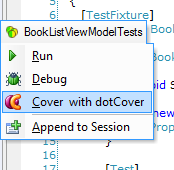
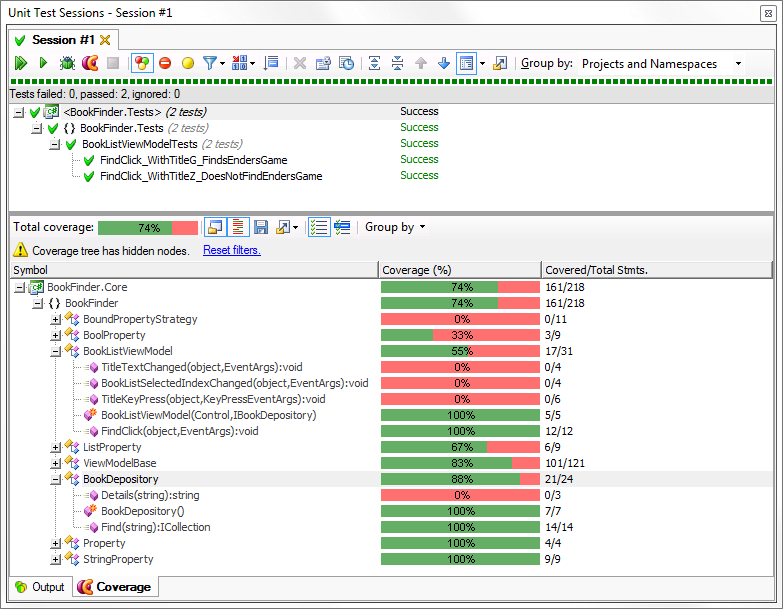
This is where I expected dotCover to shine, and it didn't disappoint - the integration with Visual Studio (and with ReSharper) was excellent. The first thing I noticed was an extra "Cover with dotCover" item in the ReSharper test menu (triggered from the yellow and green ball things). I clicked it, and it ran my tests, bringing up the familiar Unit Test results window.
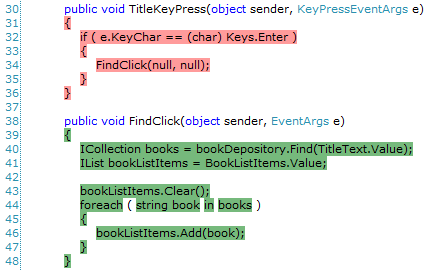
Once the tests ran, there was pause while dotCover calculated the coverage info, and then the bottom pane filled in with coverage results: green/red bars by every method in the covered assemblies. Clicking on the methods warps to the source code, which is also highlighted - covered statements have a green background, and uncovered statements have red. In fact, every source file opened in the IDE has the highlighting.
Finding tests that cover code
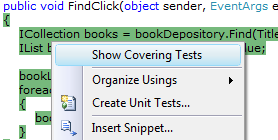
The most interesting feature that dotCover has is the ability to identify which tests covered which lines of code. I'm not entirely sold on this, thinking it more of a gimmick than anything else. When I first heard about it, I thought "I don't care which test covered which line, so long as the lines are covered. I'm here to see what isn't covered.". Yes, I think in italics sometimes. Still, I gave it a go. Right-clicking on a line of code (once coverage has been run) brought up a tiny menu full of covered lines of code. I don't know why, but it made me happy. I suppose one could use this from time to time to make sure a new test case is exercising what it's supposed to, but normally I can tell that by how a new test fails, or by what I've typed just before the test starts working. Worst case, I could always debug through a single test - something made very easy by the ReSharper test runner.
 There was one aspect of this feature that I could imagine someone using - the ability to run the tests that cover a line of code. All that's needed is to hit the "play" button on the "Show Covering Tests" popup. If the full suite of tests takes a very long time to run, this could be useful. Still, it doesn't do much for me personally - if my tests took that long to run, I'd try speed them up. If nothing else, I would probably just run the test fixture designed to test the class or method in question, instead of my entire bolus of tests.
So, running tests that cover some code is a cool feature, but it's not that useful. I'd rather see something like the automatic test runs and really cool "what's covered" information provided by Mighty-Moose.
Command Line Execution
Covering an application from the command line is pretty straightforward. I used this command to see what code my BookFinder unit tests exercised:dotcover cover /TargetExecutable=nunit-console.exe /TargetArguments=.\BookFinder.Tests.dll /Output=dotCoverOutput /Filters=+:BookFinder.CoreOne quite cool feature is to use the help subcommand to generate an XML configuration file, which can be used to specify the parameters for the cover command:
dotCover help cover coverSettings.xmlwill create a coverSettings.xml file that can be edited to specify the executable, arguments, and filters. Then use it like so:
dotCover cover coverSettings.xmlJoining Coverage Runs
Multiple coverage snapshots - perhaps from running tests on different assemblies, or just from performing different test runs on the same application - can be merged together into a comprehensive snapshot:dotCover merge /Source snapshot1;snapshot2 /Output mergedsnapshotXML Report
After generating snapshots and optionally merging them, they can be turned into an XML report using the report command:dotcover report /Source=.\dotCoverOutput /Output=coverageReport.xmlThere are options to generate HTML and JSON as well.
Note that if there's only one snapshot, the "merge" step is not needed. In fact, there's even a separate analyse command that will cover and generate a report in one go.
No Auto-Deploy
There's no auto-deploy for dotCover - it needs to be installed. And since it's a plugin, Visual Studio is a requirement. This is a small inconvenience for developers and our build servers. Having to put VS on all our test machines is a bit of a bigger deal - definitely a strike against dotCover.TypeMock Isolator support in the future
The dotCover 1.1 doesn't integrate with Isolator 6. Apparently dotCover's hooks are a little different than many other profiles (nCover, PartCover, …). I've been talking to representatives from both TypeMock and JetBrains, though, and they tell me that the problem is solved, and an upcoming release of Isolator will integrate with dotCover. Even better, a pre-release version that supports the latest dotCover EAP is available now.IIS
dotCover covers IIS, but only by using the plugin - this means that the web server has to have Visual Studio and dotCover installed, and it's a manual step to invoke the coverage. In the JetBrains developer community there's a discussion about command-line IIS support, but no word from JetBrains staff on when this might come.Statement-level coverage
As Kevin Jones notes, dotCover reports coverage of statements coverage, not sequence points. This means that a line like this:return value > 10
? Colors.Red
: Colors.White;?: would have to be replaced by an if-else block.
This isn't necessarily a major strike against the tool, but it's worth knowing, as it will skew the results somewhat.
Conclusion
Pros:- awesome IDE integration
- XML/HTML/JSON reports
- report merging
- IIS profiling
- moderate price
- no auto-deploy
- no Isolator support—yet
Overall, I like the tool. I'm a little disappointed by the lack of auto-deploy and the inability to run IIS coverage from the command line, but those problems can be worked around. I was very impressed with the in-IDE support as well as the automatically generated configuration files using the "help" subcommand. Ordinarily, the I'd say the current lack of Isolator support is a deal-breaker, but I recently demoed the product to some colleagues, and they went bonkers for the IDE integration. I guess I'll be writing JetBrains and TypeMock looking for the betas.


