A first look at Appstats - where's my time spent?
After hearing about the release of Google's App Engine SDK 1.3.1, I rushed out to try the new Appstats Event Recorder to help profile LibraryHippo. I didn't expect great things, as I'm generally happy with the performance, with one notable exception, but I was curious about the tool.
App Engine Fan has posted a great introduction of some of the features that make Appstats a useful and powerful tool - it's very easy to hook up, and seems to add very little overhead. In addition, it has very rich configuration options - one can omit classes of calls, fold calls together, select the amount of information retained about each call, and specify how many such records are retained (in what amounts to a circular buffer).
I didn't use (or need) any particularly advanced configuration, so I just installed the Event Recorder and let it go.
Here's what I saw:

I don't have an in-depth analysis, but here are some impressions:
- it's pretty
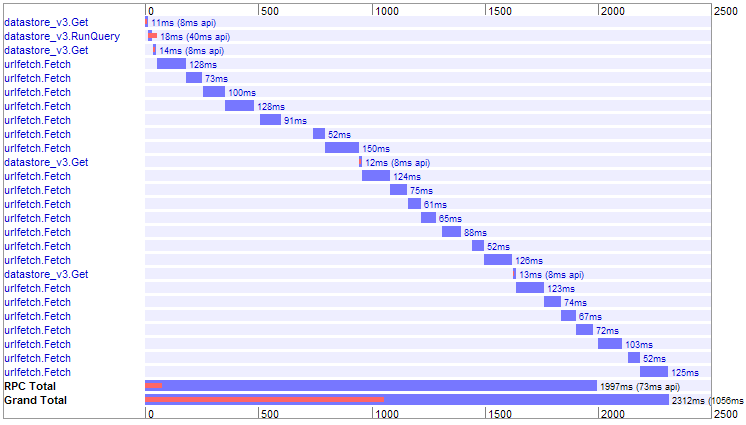
- the information is presented very well - with only minimal reading, I can see that LibraryHippo made a handful of datastore queries, as well as a series of urlfetch.Fetch calls for each library card it checked
- I can get a quick view of what's taking what proportion of the time - for example, the fetches easily dominate
- total time (about 2.3 seconds) is easy to find, as well as the amount taken by the underlying API - 73 milliseconds
- there's something else that's going on - 1056 ms for cpu + api - nearly half the elapsed time. I'm not sure what that means exactly
So far, no big surprises - I knew that most of the time was taken up by queries to the library web pages, but it's very cool to see it this way, and to see how much time is taken up going to the Datastore (not much). There's room for improvement, but 2.3 seconds is more than acceptable for this family - one of LibraryHippo's heaviest users.
Two things did stand out, though. First, in the first group of urlfetch.Fetches, there are gaps between the fourth, fifth, and sixth calls (the ones that take 128 ms, 91ms, and 52ms) and the pattern repeats (with smaller gaps) in the second batches. This is where the retrieved records are processed and transformed into a normalized representation before rendering. The total time taken is a small, but I didn't expect to see anything.
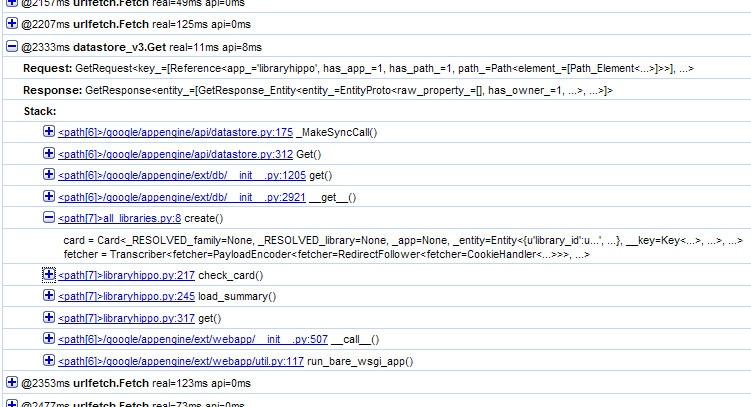
Second, there's a datastore_v3.Get call before each card is checked. This is not an explicit call that LibraryHippo makes, so I clicked on the line in the graph and got a detailed view of what was going on:

It looks like the call is coming from the create method on line 8 of the all_libraries.py file. Curious, I click on that line and lo and behold, I get a view of the source. This is very cool.
   1: #!/usr/bin/env python
   2:
   3: import sys
   4:
   5: modules = {}
   6:
   7: def create(card, fetcher):
   8:     id = card.library.type
   9:     if not modules.has_key(id):
  10:         modules[id] = __import__(id)
  11:     return modules[id].LibraryAccount(card, fetcher)
  12:
  13: def main(args=None):
  14:     if args == None:
  15:         args = sys.argv[1:]
  16:     return 0
Correlating the detail view and the source code, we see that create is handed a card parameter that has an as-yet-unresolved library instance. Accessing the library attribute on the card must complete what was a lazy load initiated when I loaded the Family entity - the cards come from the Family.card_set member.
Ordinarily, I might start investigating the gaps and the implicit gets, but I know there's a much greater threat to LibraryHippo usability, which I confirm by checking out the record for another family's notification:

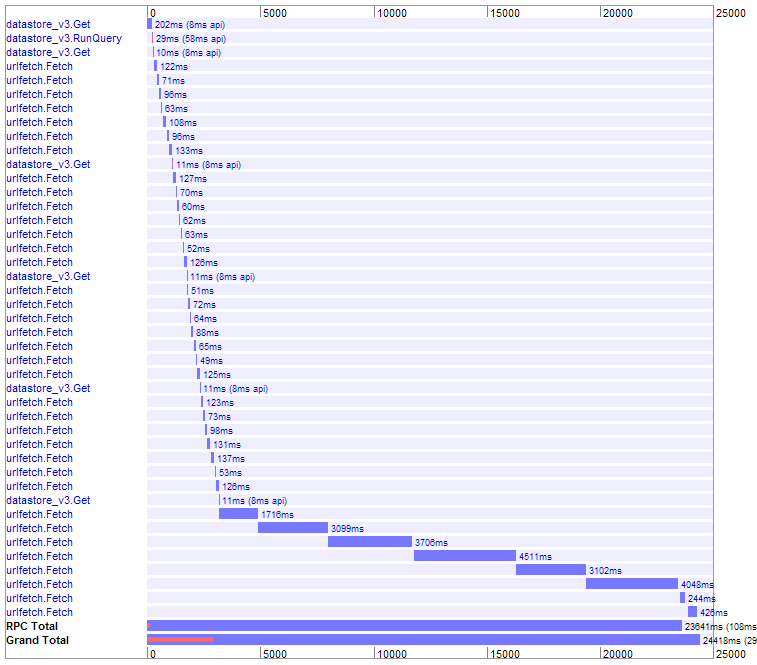
Here's where the presentation really packs a wallop - there's clearly a qualitative difference here. And what a difference - instead of 2.5 seconds on the horizontal axis, it's 25 seconds, and most of the fetches are compressed to nigh-invisibility.
There are two differences between this family's accounts and the first family's: they have an extra Kitchener Library card that the first family didn't, and they have a Region of Waterloo Library card. It's the RWL card that makes the difference: you can see it being checked in the last batch of urlfetch.Fetches. The 4 Waterloo and Kitchener library card checks are completely done after 3154ms, but the Region of Waterloo checking goes on for a further 21 seconds - for one library, and it's not an aberration - the library web site is slow.
This post is already long enough, so I'll use an upcoming one to talk about what this slowness means for LibraryHippo and how I've tried to keep it from destroying the user experience.